Get MACED Show Viewership Is Down About 53% Month Over Month: 1.32 Million Views on August Shows, 620,000 on September Shows
Public YouTube counts for Nancy Mace's Get MACED full shows (@NancyRMace), re-pulled October 1, 2026 with September complete: the 19 shows uploaded in August have 1,319,463 views and the 14 shows uploaded in September have 620,647, a drop of about 53%. Five August shows passed 100,000 views (best 204,694), none in September (best 99,536). Per show, the median fell about 23% and the mean about 36%. Public counts only, no verdict.
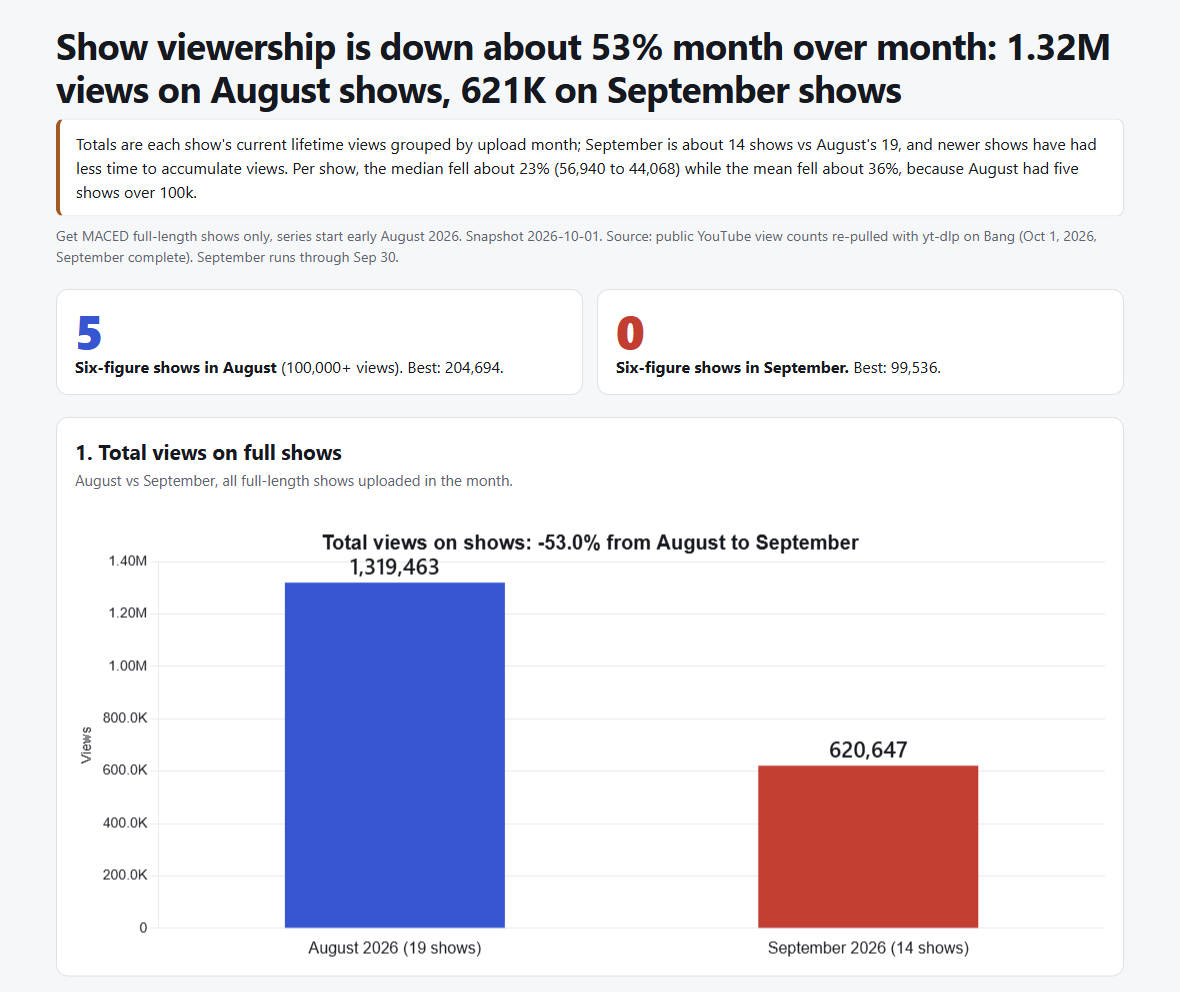
Show viewership is down about 53% month over month. The 19 full Get MACED shows uploaded in August 2026 have drawn 1,319,463 views. The 14 full shows uploaded in September have drawn 620,647.
Context, in plain terms: totals are each show's current lifetime views grouped by upload month. September has 14 shows against August's 19, and newer shows have had less time to accumulate views. Per show, the median fell about 23% (56,940 to 44,068) and the mean fell about 36%, because August had five shows over 100,000 views.
This dispatch catalogs public YouTube view counts for the Get MACED channel, @NancyRMace. Every figure is a public number from a snapshot re-pulled October 1, 2026, after September closed. September is now complete and includes the September 30 evening show. It is a record of the numbers, not a verdict on them. Readers can judge.
Total views on full shows by upload month: 1,319,463 (19 shows) in August against 620,647 (14 shows) in September, down 53.0%. Full-length shows only.
The ceiling: five shows over 100,000 in August, none in September
In August, five full shows cleared 100,000 views: 204,694 (August 10), 201,017 (August 26), 168,428 (August 7), 119,078 (August 12) and 103,835 (August 19). In September, none did. The best September show drew 99,536 views ("The Note Police Do NOT Want YOU to See," September 17).
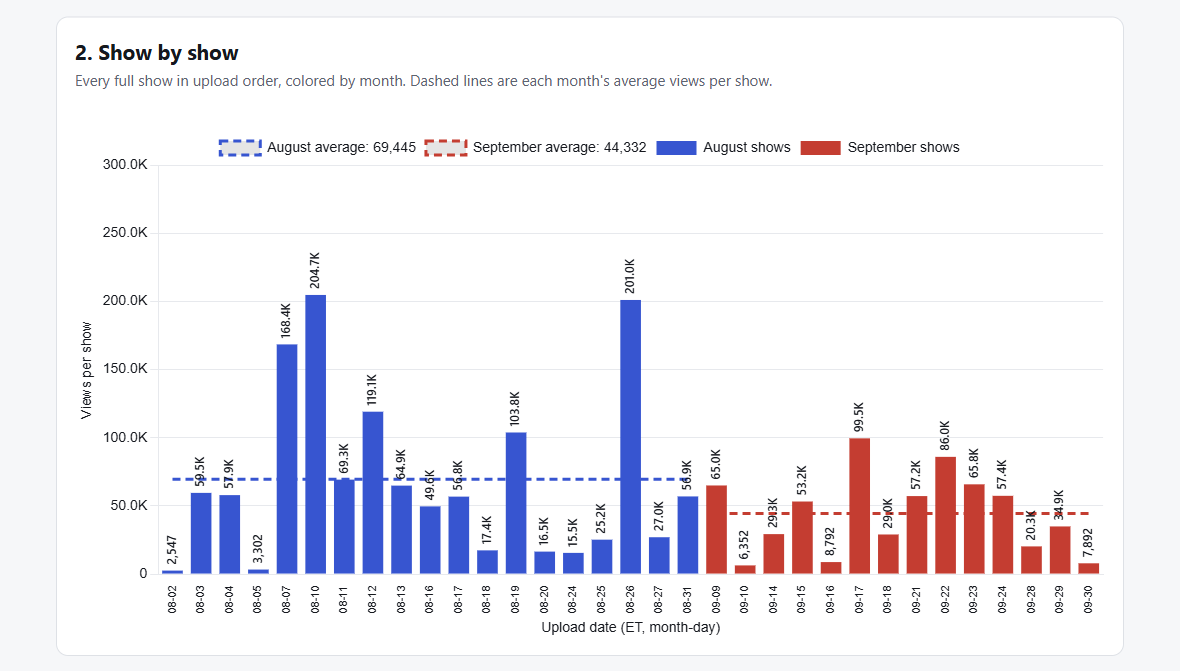
Every full show in upload order, August 2 to September 30, with each month's average views per show as a dashed line: 69,445 in August, 44,332 in September.
Per show: both the median and the mean fell
| Full shows | August 2026 | September 2026 | Change |
|---|---|---|---|
| Total views | 1,319,463 | 620,647 | -53.0% |
| Shows uploaded | 19 | 14 | -26.3% |
| Mean views per show | 69,445 | 44,332 | -36.2% |
| Median views per show | 56,940 | 44,068 | -22.6% |
| Shows over 100,000 views | 5 | 0 | |
| Best show | 204,694 | 99,536 | |
| Views per day covered | 45,499 | 20,688 | -54.5% |
The typical September show drew about 23% fewer views than the typical August show. The larger drop in the total comes from two things in the public numbers: five fewer shows were uploaded, and the top of the range shrank, with no show reaching six figures. At the low end, the September 11 anniversary show drew 6,352 and the "$5,000 Checks" show drew 8,792.
The 14th September show is last night's episode on the last U.S. troops leaving Iraq, uploaded September 30. It has 7,892 views and 105 comments so far and is still climbing. Only the 9/11 show is lower among September's 14 shows, so it sits 13th of 14 for now.
Views per day covered is simple arithmetic on the totals: August 3 to August 31 is 29 days and September 1 to September 30 is 30 days. It is not a daily measurement.
What this does not show
These numbers do not say why viewership moved, and this dispatch does not claim a cause. These are lifetime views by upload month: September has 14 shows against August's 19, older shows have had more days to accumulate views than newer ones, and a month-to-month total is not an age-matched comparison. Shows uploaded in the last few days, including the September 30 episode, are still climbing.
By the numbers
- Snapshot: October 1, 2026 (public YouTube counts, full-length shows only, September complete through the September 30 evening show)
- August 2026: 19 shows, 1,319,463 views, mean 69,445, median 56,940, best 204,694, 5 over 100,000, 45,499 views per covered day
- September 2026: 14 shows, 620,647 views, mean 44,332, median 44,068, best 99,536, 0 over 100,000, 20,688 views per covered day
- Change, September versus August: total -53.0%, mean -36.2%, median -22.6%, views per day covered -54.5%, shows uploaded -26.3%
- Combined: 33 shows, 1,940,110 views
Sources and related coverage
- Channel: Get MACED, @NancyRMace on YouTube
- Playlist: FULL EPISODES
- "What They WON'T Tell You About Ilhan Omar's Immigration Records" (201,017 views)
- "MEN IN THE WNBA?": Nancy Mace EXPOSES the Hostile Takeover (204,694 views)
- "The Note Police Do NOT Want YOU to See" (99,536 views)
- "25 years later, we still won't say who did this | remembering 9/11" (6,352 views)
- "The $5,000 Checks Have a Catch Nobody Read" (8,792 views)
- "The Last U.S. Troops Left Iraq Today. What They Took Home CHANGES Everything" (7,892 views, 105 comments)
Methodology: All counts are public YouTube view counts for full-length Get MACED shows, re-pulled with yt-dlp on October 1, 2026, after September closed. The 14 September shows include the September 30 evening Iraq episode. Each show's current lifetime views are grouped by its upload month in Eastern time. A "full show" is a member of the channel's own FULL EPISODES playlist, plus any channel-only solo episode the playlist missed. Shorts and other clips are excluded. View counts are point-in-time, older videos have had more days to accumulate views, and recent uploads are still climbing.
Read next
 September 22, 2026 · Dispatch
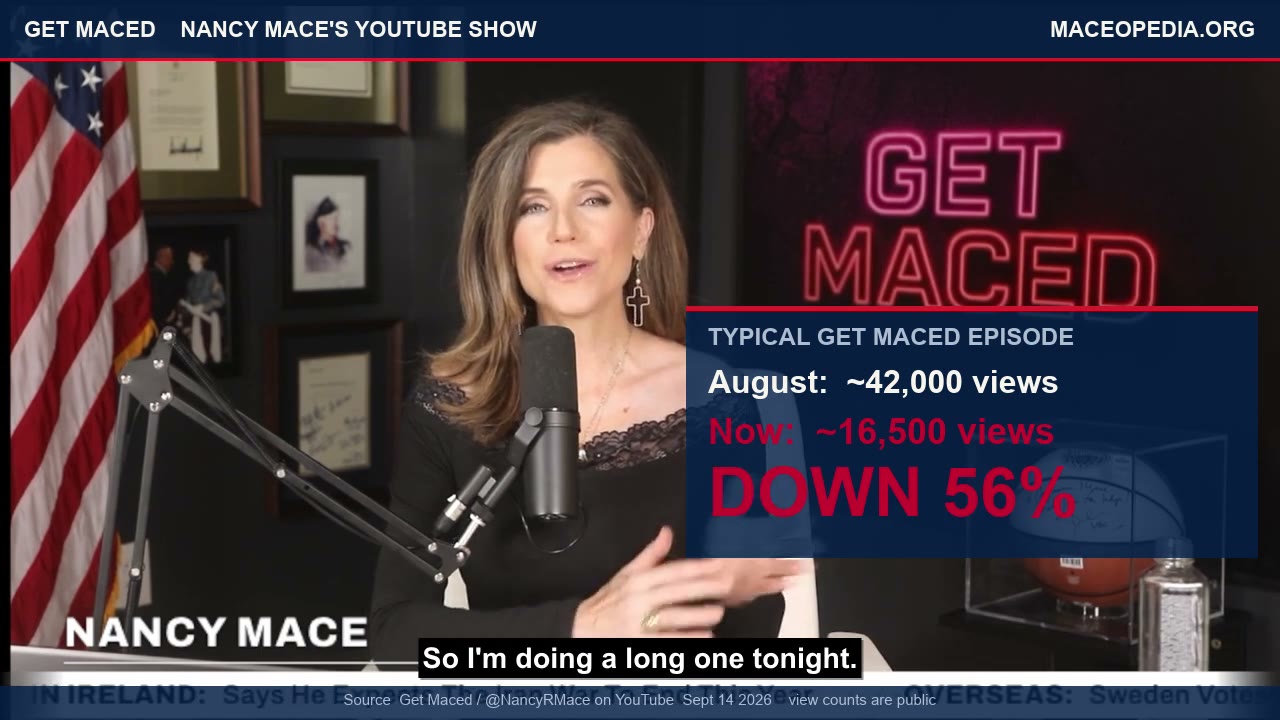
Get Maced: the ratings tank. A typical Nancy Mace episode has lost more than half its viewers since August
Nancy Mace's Get Maced show is still posting nightly, but the number that measures reach, per-episode views, has more than halved. A typical solo episode has fallen from a working median near 42,000 views in August to about 16,500 now, a drop of roughly 56 percent, with policy episodes bottoming out in the single-digit thousands.
 October 7, 2026 · Dispatch
'I'm Sort Of, Kind Of Known for It': Nancy Mace Describes Her Own Altercation Record, Calls Cory Mills 'a Teetotal POS' on Air, and Recalls Telling Jasmine Crockett to 'Take It Outside'
On the October 1, 2026 episode of her Get Maced podcast, Nancy Mace told her audience, 'Full disclosure, I'm a politician. I have gotten into an altercation or two in my time. I'm sort of, kind of known for it. Watch this.' She then played House floor footage of herself from November 2025, when a clerk read her resolution to censure Rep. Cory Mills, and narrated it: 'I'm standing in the corner, staring down Cory Mills. I may have said a four-letter word or two, telling him how I really feel.' She called Mills 'a teetotal POS' and added, 'I'm also the one that told Jasmine Crockett to take it outside.' Every quote is verbatim from her video. The record behind each line, with sources, is below.
 October 7, 2026 · Dispatch
'It's Pedophilia. It's Grooming.': Nancy Mace Calls Texas Senate Candidate James Talarico a Groomer and 'Not a Christian,' on a Poll Number No Published Poll Shows
In her October 1, 2026 Get Maced episode, Rep. Nancy Mace spent about five minutes on James Talarico, the Democratic nominee for U.S. Senate in Texas, over his record on transgender athletes in girls' sports. She said 'It's disgusting. It's pedophilia. It's grooming. And here's a so-called Christian running on it,' told viewers 'You should not vote for this guy,' and said that someone who 'doesn't protect women in private spaces where they're undressed isn't a Christian,' while also saying 'I'm not carrying the water for anyone in this race.' She opened the segment with 'Ken Paxton is now three points ahead of Talarico.' The Fox News poll taken September 24 to 28 had Talarico ahead, 51 to 49, and Maceopedia found no published poll with Paxton ahead by three. Every characterization of Talarico in this entry is hers. The site's own voice is confined to the poll number and the public record.
 October 7, 2026 · Dispatch
'75,000 Subscribers' at 0:35, 'Almost a Hundred Thousand' at 14:32: Nancy Mace Gives Two YouTube Counts in One Get Maced Show
Thirty-five seconds into her Thursday, October 1, 2026 Get Maced stream, Nancy Mace said her YouTube channel had 'just hit our milestone' of 75,000 subscribers. Thirteen minutes and 57 seconds later, in the same stream, she said 'we have almost a hundred thousand, we're getting towards a hundred thousand on YouTube.' Maceopedia's tracker had the channel at 75,400 that day. Six days later YouTube's own public display read 77K. This entry puts the two lines, the clock, and the public count side by side. Every quote is verbatim from her stream.
 October 7, 2026 · Dispatch
'She Should Get the Firing Squad': Nancy Mace Asks the South Carolina Legislature to Write a Death Penalty for One Untried Woman, Then Offers the Firing Squad to Lindsay Clancy
Two minutes into her October 1, 2026 Get Maced episode, Rep. Nancy Mace says she is 'begging the state legislature to make one exception' to South Carolina's death penalty for a Spartanburg County woman who has been charged with attempted murder and has not been tried: 'She should get the firing squad. We have that here.' She then offers the state's firing squad to Lindsay Clancy, a Massachusetts defendant whose trial is pending, and to an unnamed Tennessee defendant. The U.S. Constitution bars a state from passing a bill of attainder or an ex post facto law, so a death penalty written for one named person, after the alleged act, is not something any legislature can enact. Every quote here is verbatim from her own upload, checked against the audio. The woman she names is charged, not convicted. Her children are not named. Maceopedia reaches no conclusion about any defendant and assigns Mace no motive; the words are hers.
 October 6, 2026 · Dispatch
'I Want You to Know It's Not Real': Nancy Mace Pulls Off Her Wig Topper on Camera and Says PTSD Has Cost Her About Half Her Hair
On the morning of October 4, 2026, Nancy Mace posted a three-minute video to her own YouTube channel titled 'Nancy Mace Reveals Her SECRET to Good Hair.' Seated in her Get Maced studio, she says the hair people have been complimenting is 'not real,' says she has lost 'about half my hair' and attributes that to PTSD, lists the peptides, vitamins, topicals, Rogaine and methylene blue she says she uses, and then, at about 1:38, unclips a human-hair 'wig topper' on camera, holds it up, and parts her remaining hair with both hands to show her scalp. She finishes the video without the topper on. Every quote below is verbatim from her video. Maceopedia takes no position on her health; this entry records what she said and showed, and sets it beside her earlier public posts about her hair.